


In this review
With the help of expert hosts, we evaluated the leading short term rental market analytics tools: AirDNA, Key Data, and Beyond.

Beyond Market Insights
Beyond was our clear winner. At a fraction of the cost of its competitors, users get access to unlimited market reports with top tier data quality and insights.
In this review
If you’re here, you know that competition in the short-term rental (STR) market is fierce. Whether you're scouting your next Airbnb investment or optimizing your current listings, access to the right market insights is critical for boosting revenue, occupancy, and listing visibility.
That’s why we put the three leading STR market insights platforms to the test - Beyond, AirDNA, and BNBCalc - comparing them on price, data quality, and features. One clear winner emerged, and spoiler alert: it’s not the most well-known - or expensive - Airbnb pricing tool on the market.
Airbnb Pricing Tools, Compared:
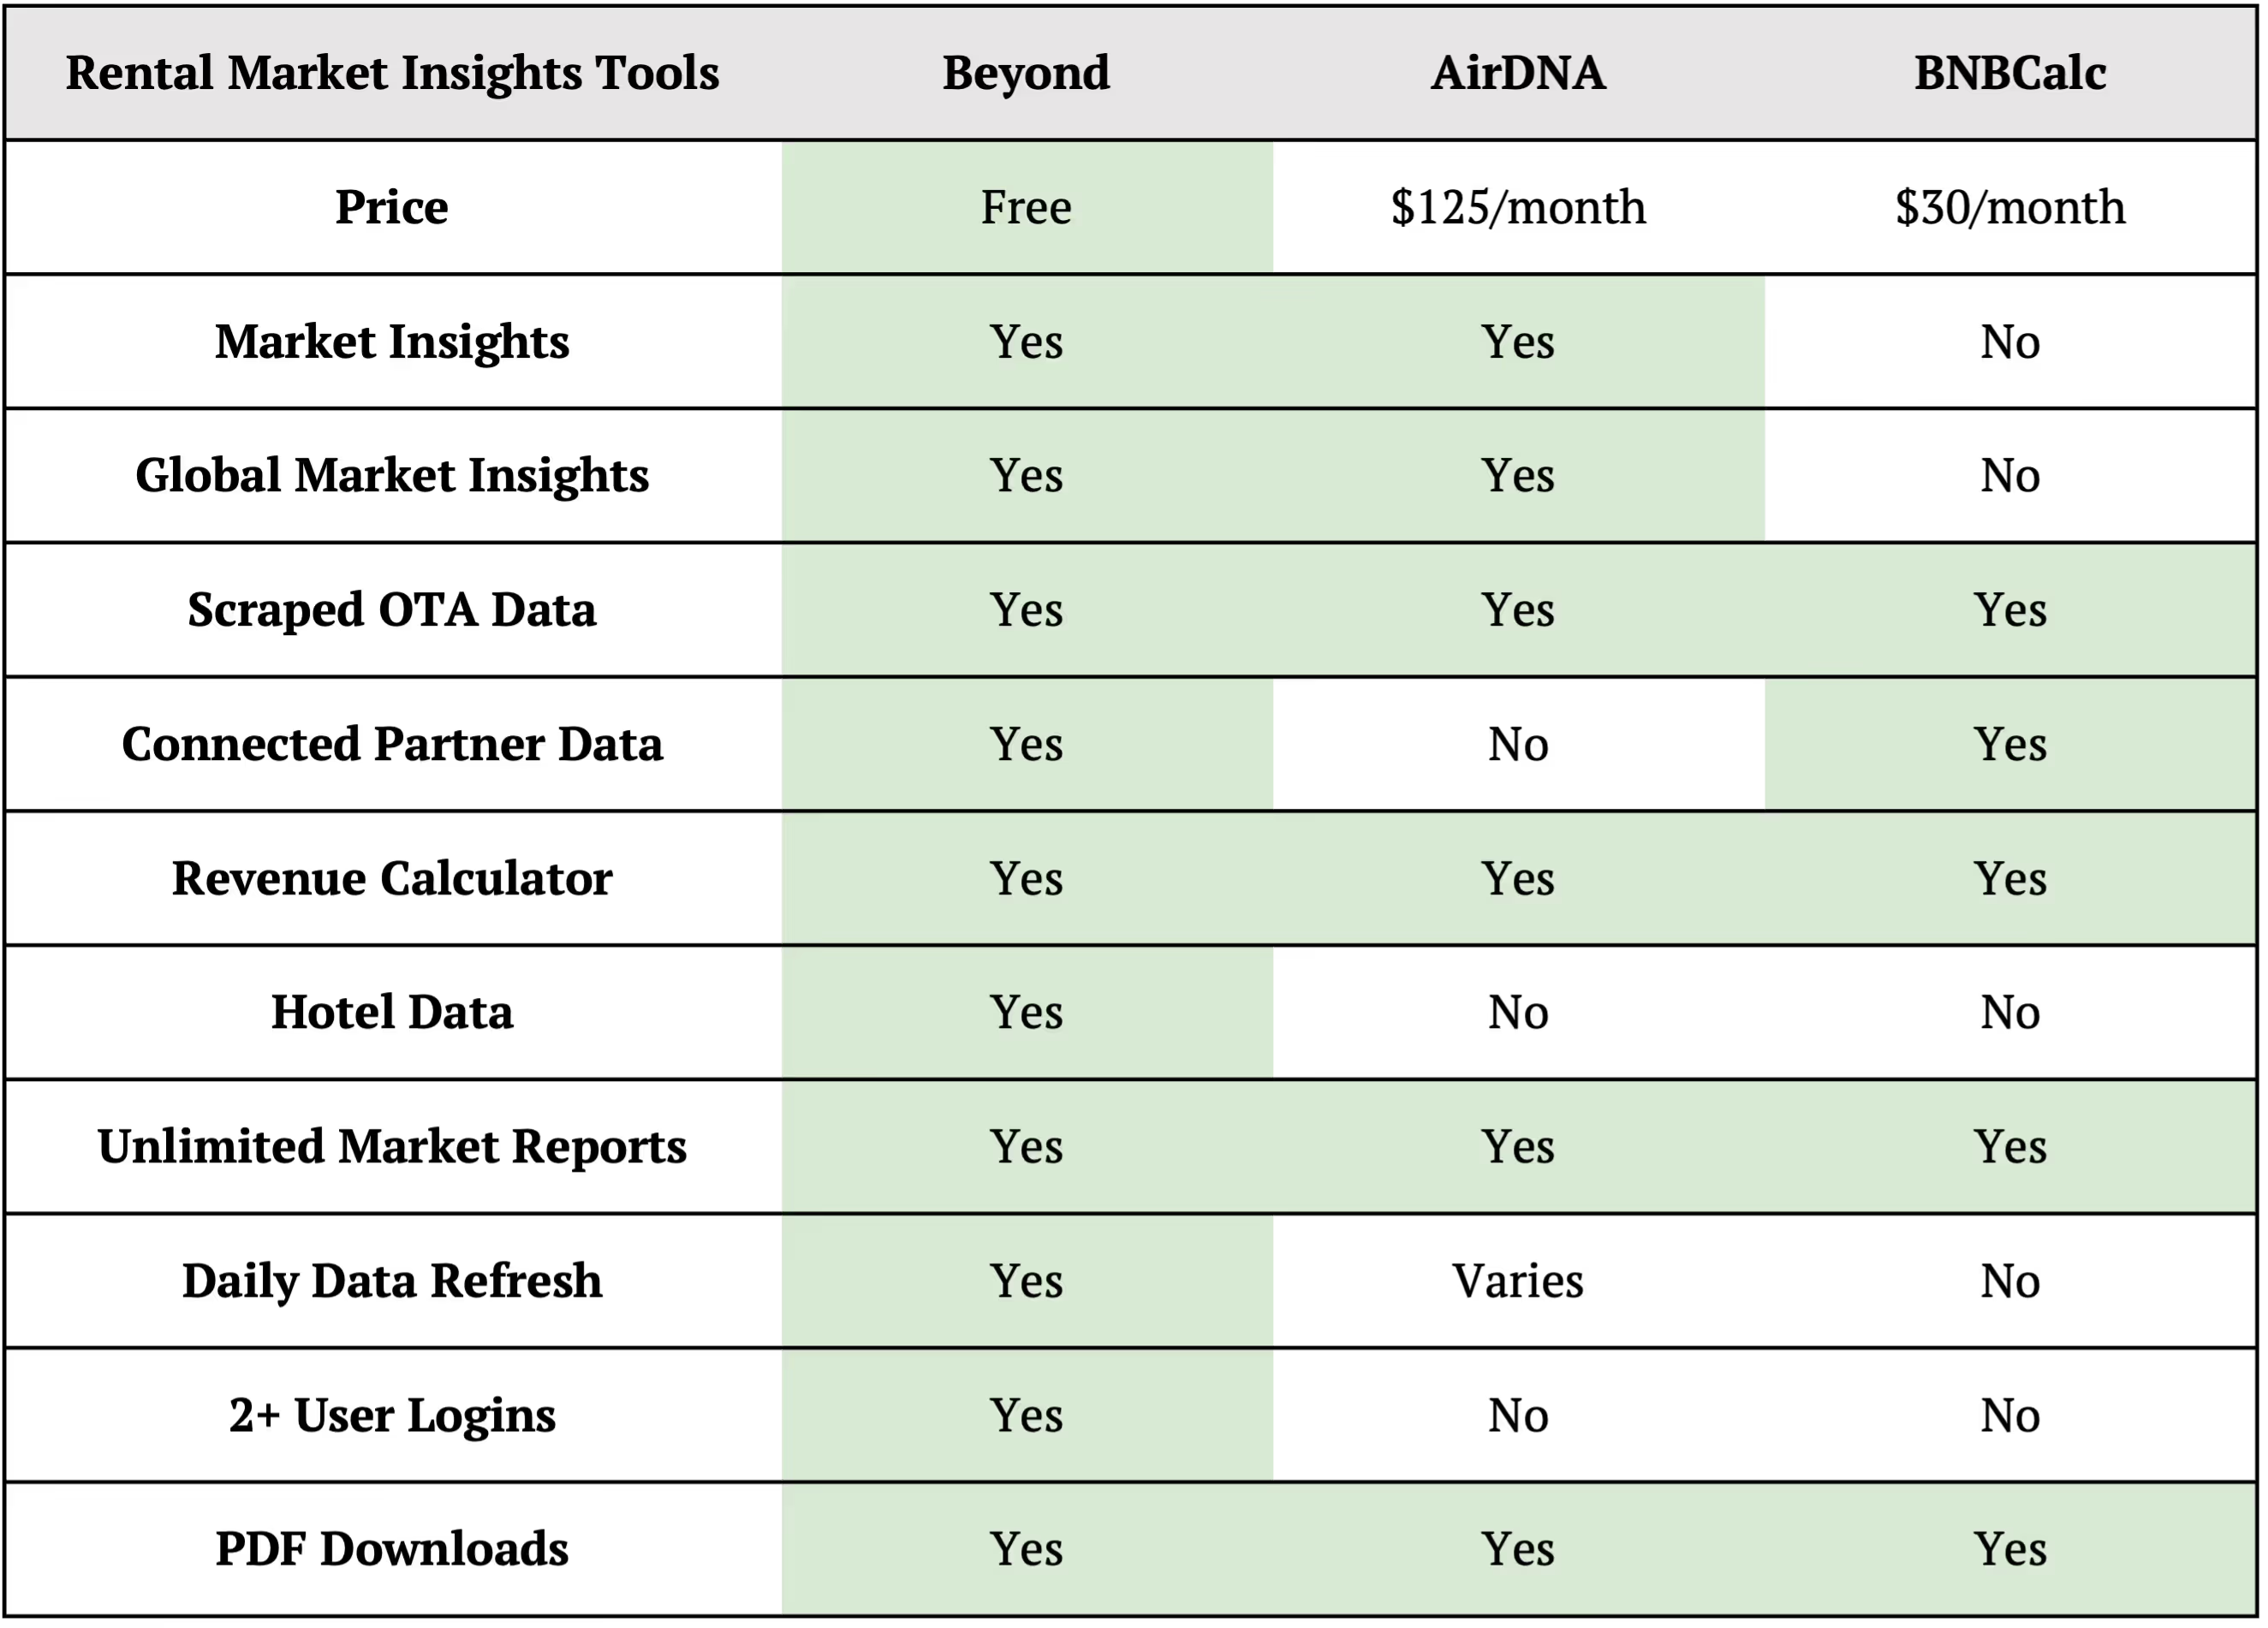
Price
Beyond Wins As The Only Free Option
If we’re just looking at price, Beyond is the clear winner. It offers access to a full suite of forecasting tools, global market data, unlimited report downloads, and multi-user access - free of charge.
BNBCalc’s base plan is $30/month for 1 user. AirDNA is the most expensive of the three at $125/month for 1 user - best for property managers with a budget to spend.
It’s clearly the most affordable option, but let’s see if Beyond’s STR Insights are up-to-par on features, accuracy, and user experience.
Data Accuracy and Coverage
Beyond Wins With The Best Data
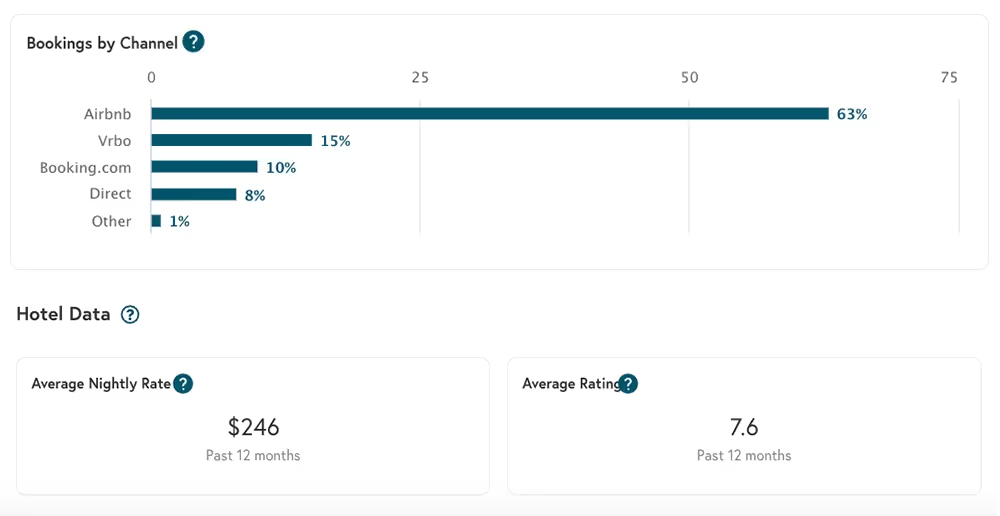
Beyond pulls listing and transaction data directly from over 50 property management systems (PMS), including Airbnb, Vrbo, and Booking.com - the world’s largest short-term rental platform. It is also the only tool in this lineup to include hotel benchmarking, helping hosts get a full picture of the STR market. That’s billions of data points that other tools are missing in their projections.
While BNBCalc also uses PMS data, it sources the data indirectly through Airbtics, a third-party provider of Airbnb data. It unfortunately does not include Booking.com or hotel data, and is not transparent about how often data is collected and updated, meaning its insights are less accurate.
Surprisingly, AirDNA is last here. It only scrapes data from public listings - not actual transactions - causing serious doubt about the accuracy of its projections. Like BNBCalc, it also excludes Booking.com and hotel data.
Forecasting
It’s a Tie: Each Dynamic Pricing Tool Has Different Use Cases
All three platforms offer feature-rich forecasting tools with an Airbnb revenue calculator, but are designed with slightly different users in mind.
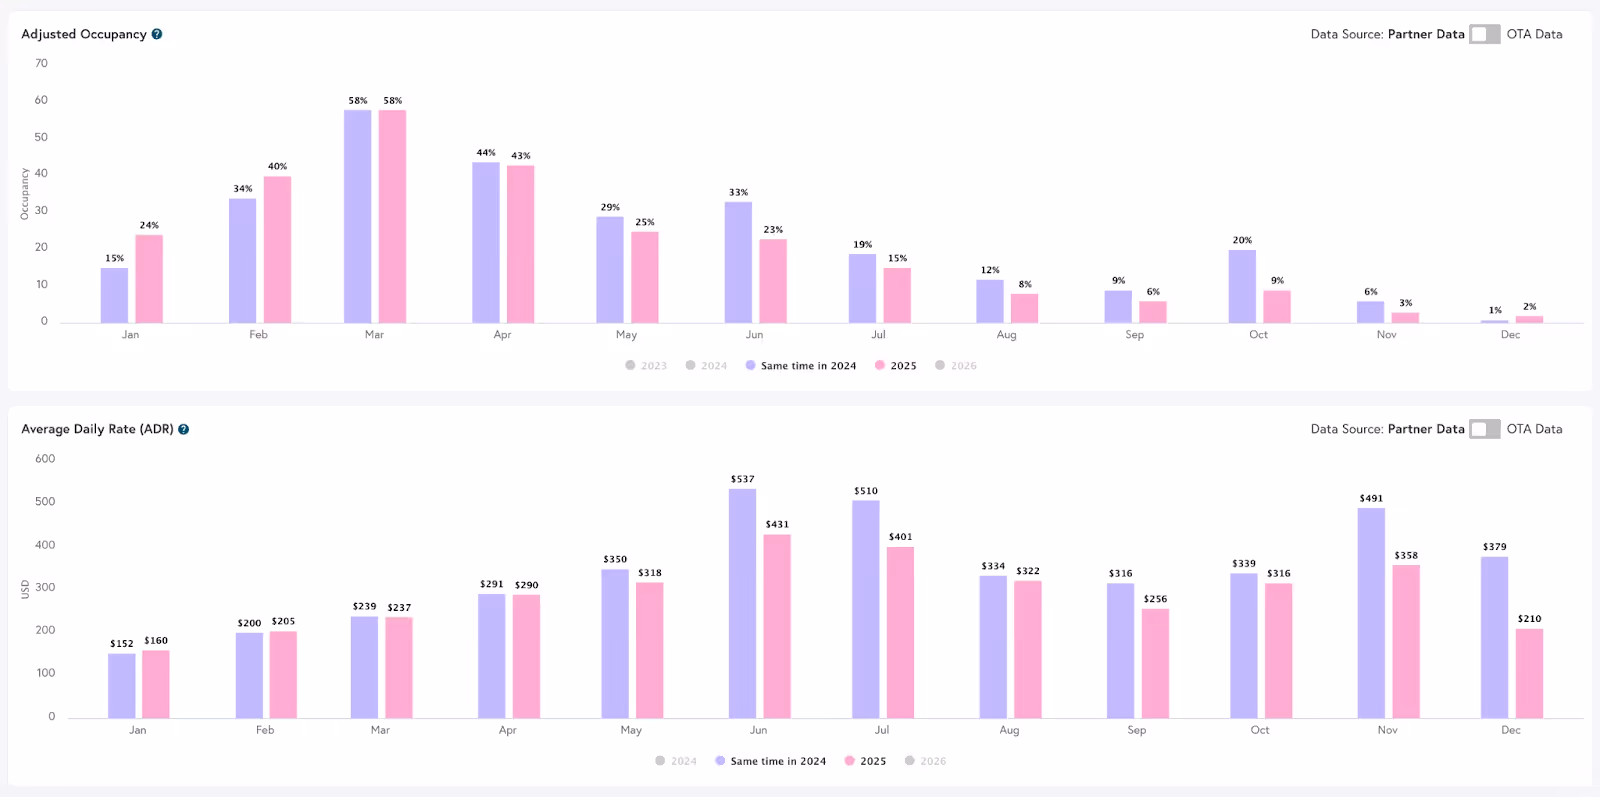
Beyond is the best tool for small to mid-sized hosts and investors. It includes dynamic revenue, cost, and occupancy forecasting by neighborhood, bedroom count, and property type. And because it’s based on real booking data, not estimates, users can trust what they’re seeing.
Its reporting also includes forward-looking booking pace, seasonal trends, and competitive benchmarks. Finally, users can toggle between views for different markets, track historical vs. projected performance, and download custom reports.
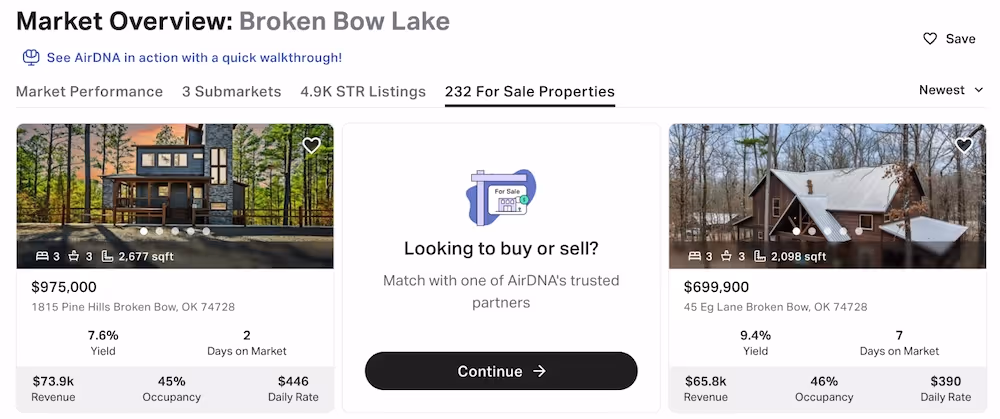
AirDNA offers similar capabilities. With its “Rentalizer” tool, users can input a property address to instantly see projected annual revenue, average daily rate (ADR), and occupancy.
AirDNA allows for some customization, like bedroom count, property type, and guest capacity. For a quick snapshot of a property’s earning potential, it’s intuitive and easy to use; but of course, this comes with questionable data quality.
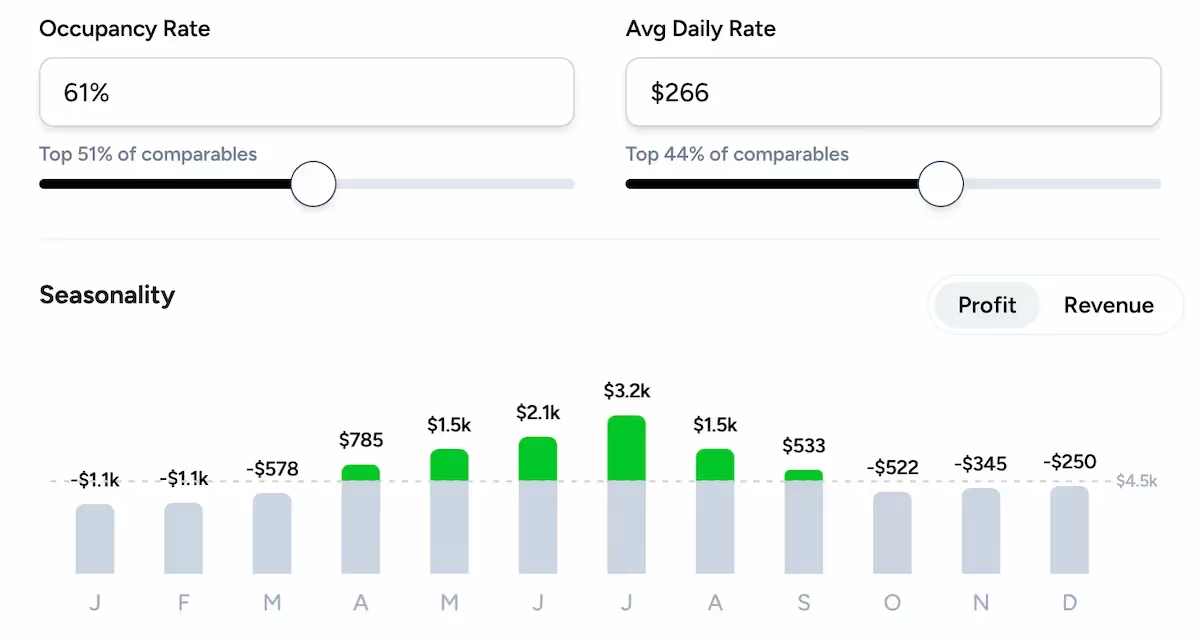
Finally, BNBCalc offers the most limited insights. It allows you to put in a property address to see projected annual revenue, ADR, and occupancy, but it does not include toggles for users to see trends for different markets and historical vs. projected performance.
Its reports include benchmarks and seasonal trends, but do not include forward-looking booking pace or demonstrate how seasonality changes over time. Paired with its questionable data quality, the tool seems most useful for agents looking to sell properties to STR investors rather than the investors themselves.
User Experience
Beyond is Easy to Use and Offers Unlimited Reporting
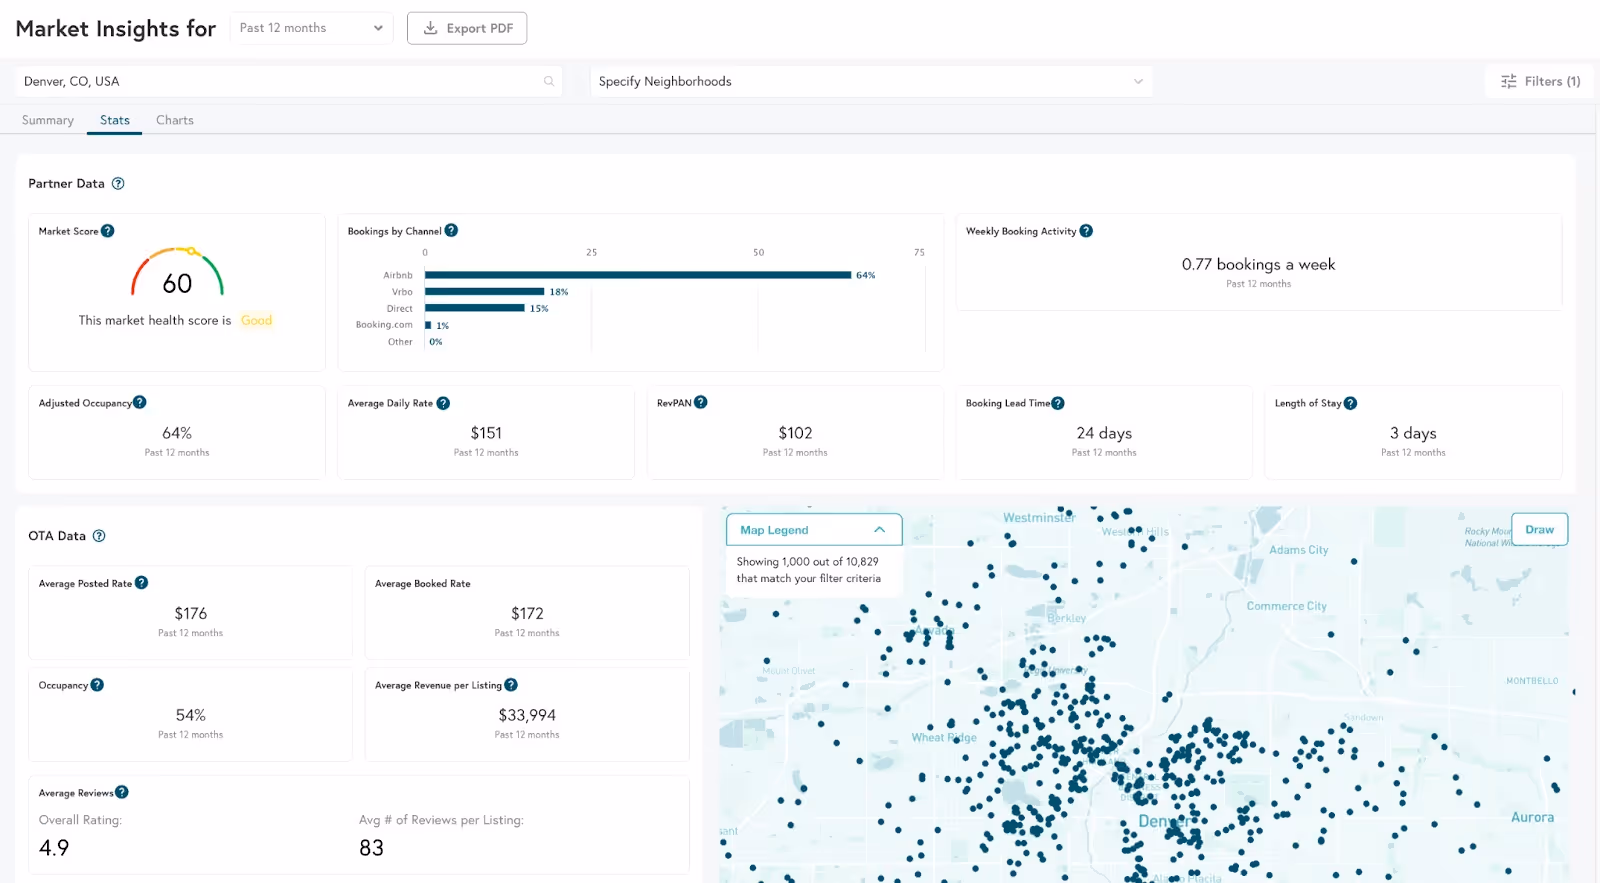
Beyond’s market dashboards are clean and interactive, with filters that let you drill down by city, neighborhood, bedroom count, and more. Its interface is modern and intuitive, helping users quickly spot trends and make informed decisions.
The standout feature, however, is that users can download unlimited custom reports - making it easy to share with team members or clients. Plus, multiple users can access the same account without having to worry about login issues or extra charges.
AirDNA also offers a polished, user-friendly experience. Its map-based visualizations and Rentalizer are intuitive for investors doing quick research on potential properties. However, usage is limited - there are caps on report exports and how many users can access the account at once. At a $125/month price, that feels restrictive, especially for teams who need to collaborate or pull reports regularly.
Finally, BNBCalc’s interface is similarly polished and user-friendly, but its reports are limited to the address level and are over-simplified. For example, while Beyond shows how ADR changes seasonally and over time, BNBCalc only predicts a single, static ADR. While users can download unlimited reports, only one user can access the same account at a time. At $30/month, the BNBCalc’s functionality feels limited compared to Beyond’s free tool.
The Best Rental Market Insights Tool?

Which short-term rental market insights tool is best? After testing them side-by-side, we’re going with Beyond Market Insights. Not only is it the only truly free option, users get access to the best STR data available, displayed in an easy-to-use dashboard with unlimited report downloads.
Want to give Beyond a try? Sign up for free:


